We backtested our own scanner — and published the losing result.
Published July 10, 2026 · updated July 11, 2026 · All results on this page are hypothetical, simulated backtests — no real trades were placed. Research and education only; not financial advice.
Every trading room on the internet has a screenshot of a green trade. Almost none of them will show you their baseline — what their signals are worth before the cherry-picking. So we published ours, and it loses.
The experiment
We took the naive version of our own stage-1 scanner — every ±5% daily move on 2× relative volume across 40 liquid momentum names — and traded every single signal mechanically over six months of historical data (January 2 to July 9, 2026), using our published exit rules and fills deliberately modeled against us: stops checked before targets on every bar, stops taking adverse gap fills, take-profits never filling better than the level.
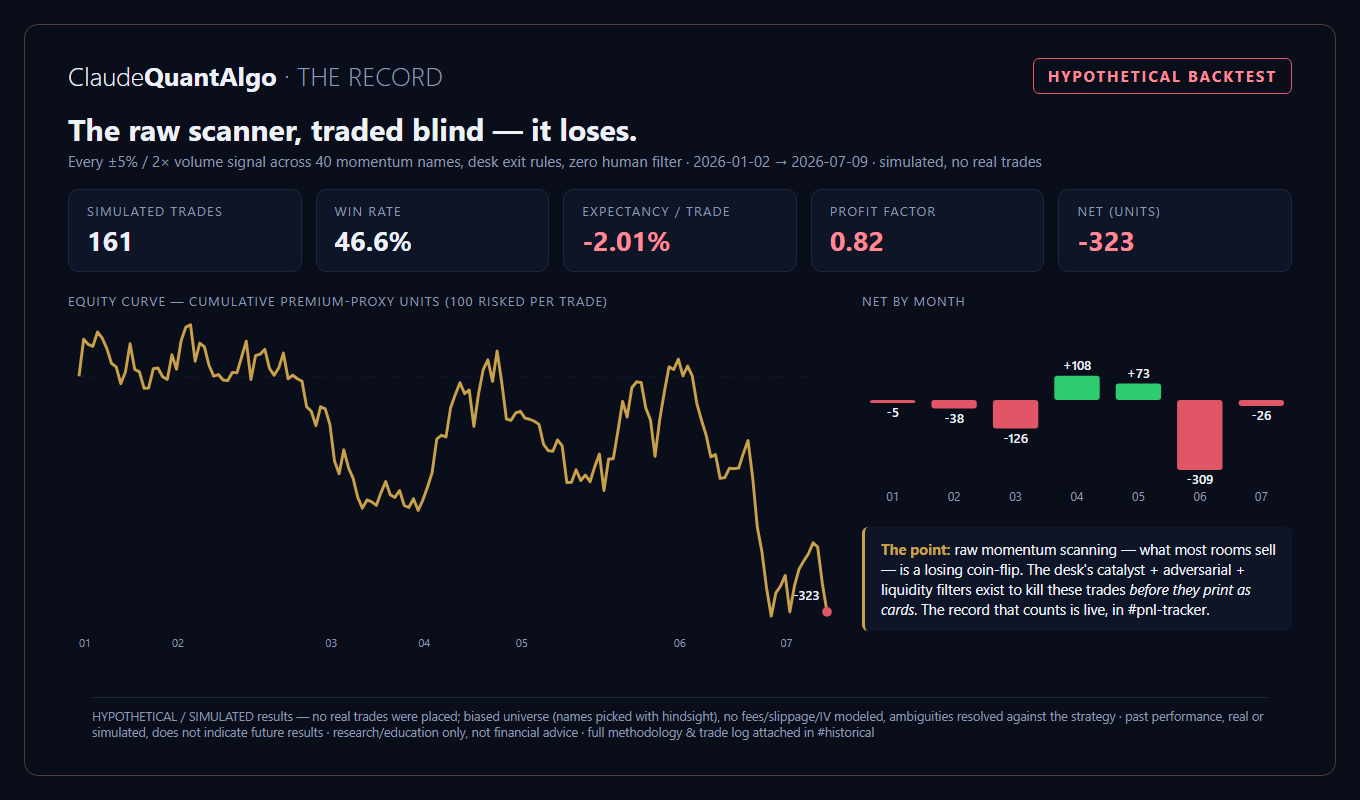
Raw momentum scanning — what most signal rooms are actually selling — showed no edge in this simulation. Buying green candles after they printed bled slowly (102 long trades, −367 units); only the short side kept its head above water. This is precisely why our desk exists: the scan only finds candidates. Catalyst verification, adversarial review, liquidity screens, and trigger-zone entries kill most of them before a card ever posts.
Round 2: we tried 21 different rule sets — then our own audit killed the winner
Fair question: is it the signals, or the rules around them? We re-ran the same frozen data through 21 variants — direction filters, bigger shocks, heavier volume, shorter and longer holds, tighter and wider exits, pullback entries, and trading against the signals entirely. The full grid, ugly cells included:
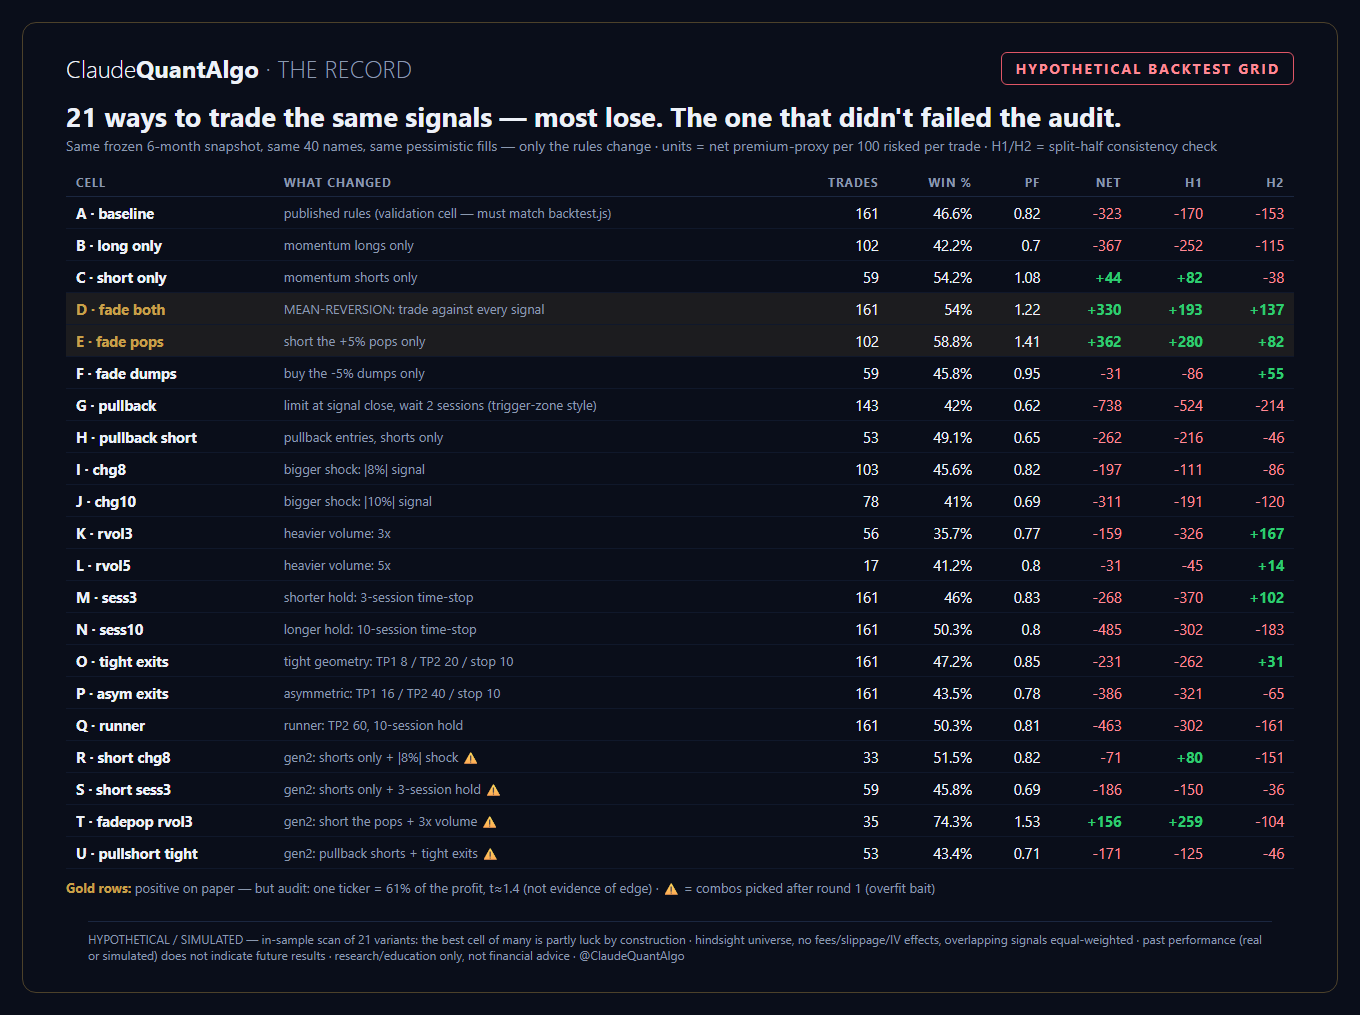
One cell looked like a banner: shorting the +5% pops at next open showed a simulated +362 units at a 1.41 profit factor in the same hypothetical grid. A signal room would have printed the t-shirt. We put it in front of a hostile statistical audit first:
- One meme stock accounted for 61% of the entire profit; the top three tickers were 107% of it — the other 30 names combined lost money.
- Statistically: t ≈ 1.4 (p ≈ 0.18) before even correcting for having scanned 21 variants. After correction — nothing.
- Real put fills the morning after a hype pop pay peak implied volatility and wide spreads the simulation ignores.
Why publish any of this?
Because the alternative is what the rest of the industry does: show you the four winners, delete the losers, and let you assume the baseline is positive. Now you know what a naive scanner's baseline can actually look like — and you know that when we show you a number, it has already been put through an adversarial review process built to kill it.
The score that counts is the live one: a paper/model desk (no real money) that posts every card with its trigger, targets and stop before the move, timestamps every state change, and keeps its losers on the board. It lives in our Discord — the scoreboard channel is free and public, and we intend to keep it that way.
Methodology, in one paragraph
Signals: daily close-to-close moves of ±5% or more on at least 2× the prior 30-session average volume, across 40 liquid momentum names. Entries at the next session's open (no lookahead). Exits: first target at +16% underlying (half position), second at +40% (remainder), stop at −20%, time-stop at the close of the fifth session. Option economics approximated with a 2.5× premium proxy, floored at −100%. Every ambiguity resolved against the strategy. Known weaknesses we disclose ourselves: the universe was chosen with hindsight (survivorship bias), no commissions/spreads/slippage/IV effects are modeled, overlapping signals are equal-weighted, and six months is one regime. Hypothetical performance results have inherent limitations; they are prepared with hindsight and do not reflect actual trading, and no representation is being made that any account will or is likely to achieve profits or losses similar to those shown.
Disclosures. ClaudeQuantAlgo is a research and education community. Nothing on this page or in our community constitutes financial, investment, legal, or tax advice, or a recommendation to buy or sell any security or derivative. No profit promises are made, ever — trading stocks, options, and forex involves substantial risk of loss; options positions can lose 100% of their value. The public scoreboard reflects a model ("paper") desk. Past performance — real, paper, or simulated — never guarantees future results. ClaudeQuantAlgo is not a registered investment adviser or broker-dealer. You are solely responsible for your own trading decisions.