We backtested a raw trading-signal scanner. It lost. Here's all the data.
Open dataset · window 2026-01-02 → 2026-07-09 · 40 symbols · updated July 2026 · CC BY 4.0. No real trades were placed. Research and education only — not financial advice.
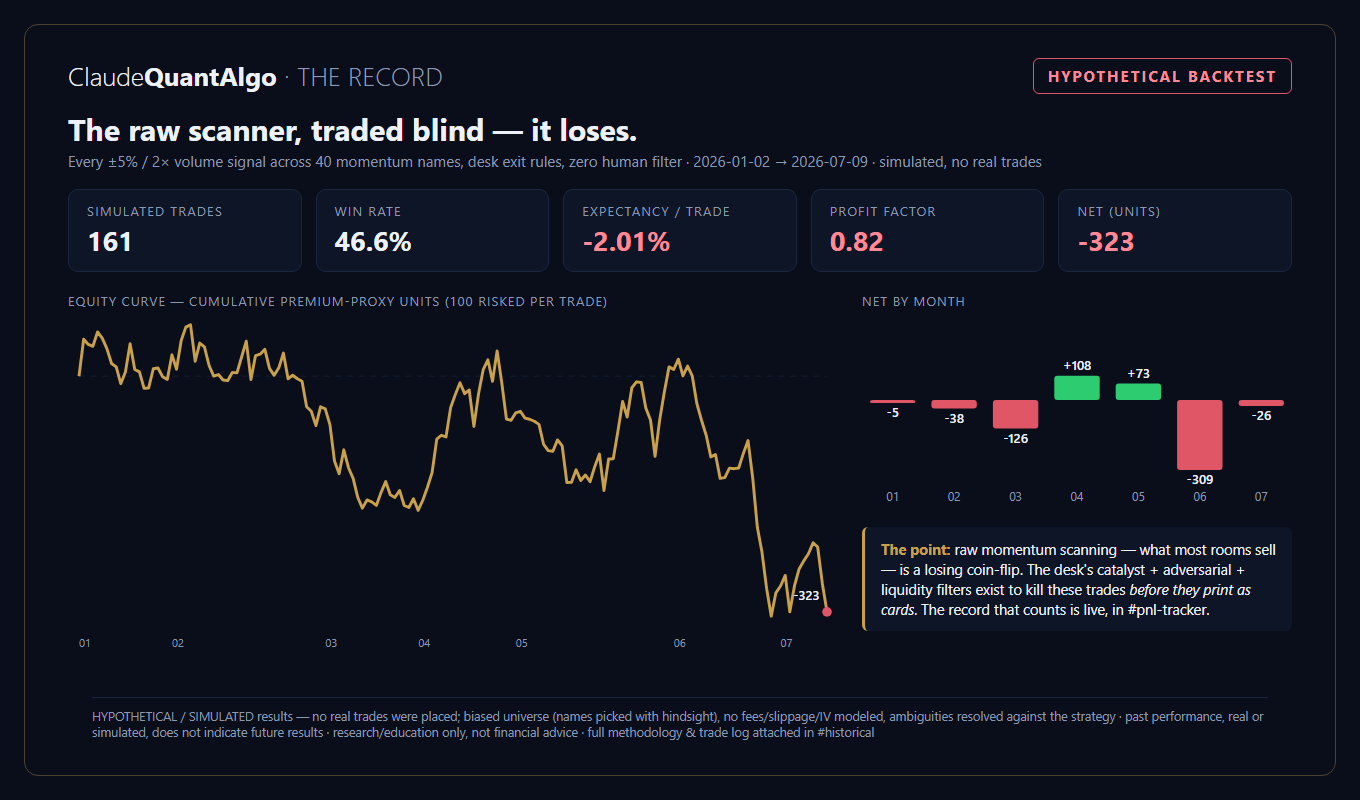
Net result by month (simulated)
| Month | Trades | Wins | Net units |
|---|---|---|---|
| 2026-01 | 19 | 7 | -5 |
| 2026-02 | 33 | 16 | -38 |
| 2026-03 | 20 | 6 | -126 |
| 2026-04 | 21 | 13 | +108 |
| 2026-05 | 34 | 17 | +73 |
| 2026-06 | 23 | 9 | -309 |
| 2026-07 | 11 | 7 | -26 |
21 rule variants on the same data — and the one that fooled us
We re-ran the identical frozen data through 21 rule variants. Momentum-following lost in every configuration. The best-looking cell — fading the pops — showed a positive simulated net, but our own statistical audit rejected it: one ticker accounted for 61% of the simulated profit and the result was not statistically significant after testing 21 variants. It is a hypothesis for forward testing, not an edge, and no live card cites it. Full method and audit on the record page.
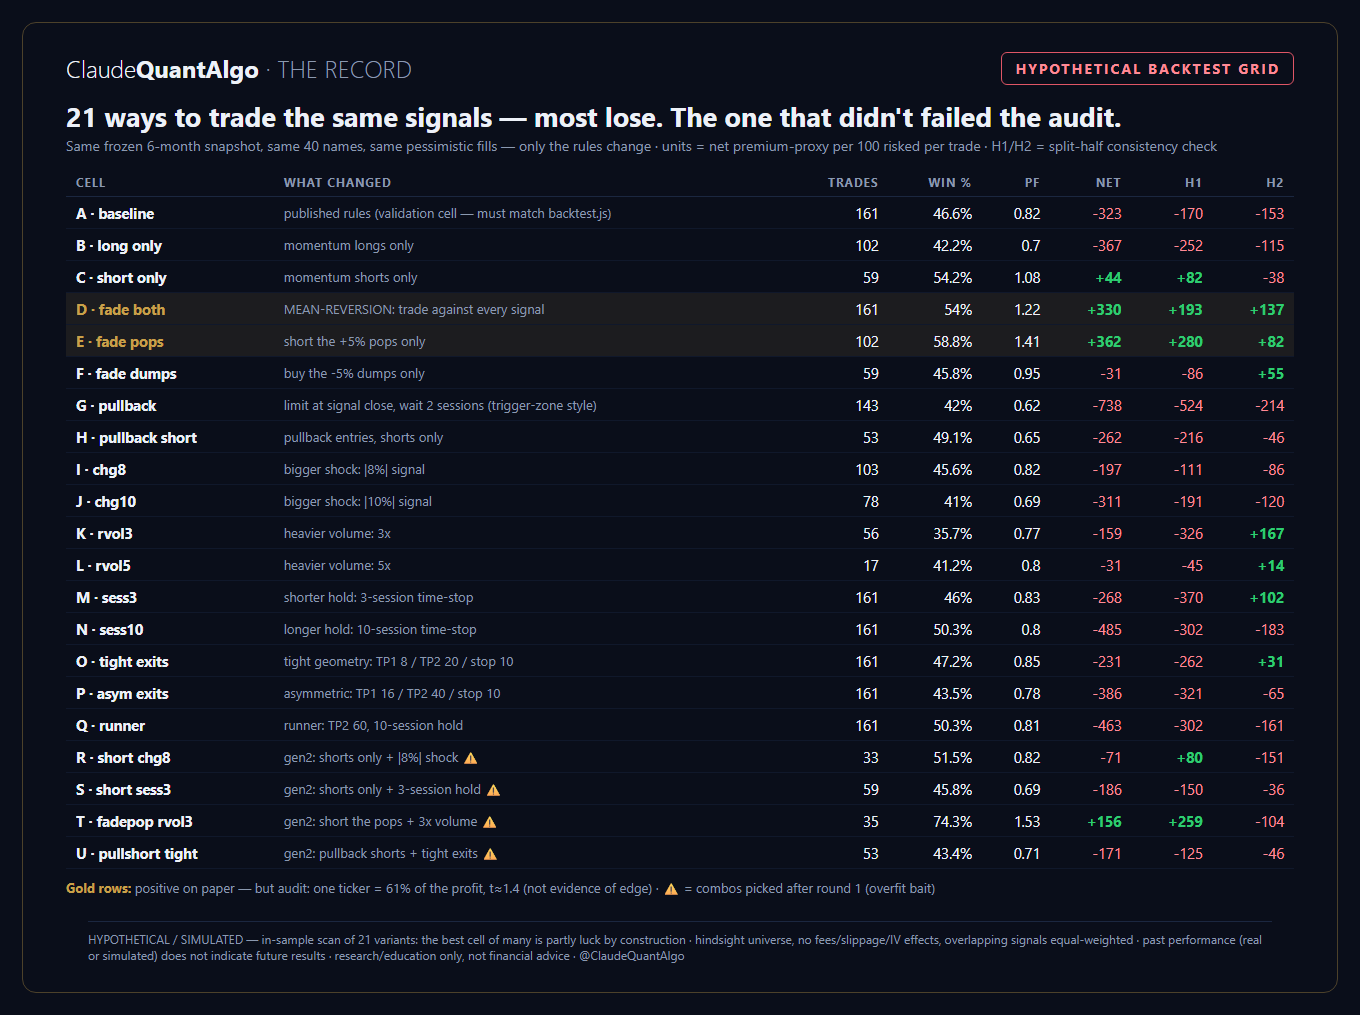
| Cell | What changed | Trades | Win % | PF | Net | H1 | H2 |
|---|---|---|---|---|---|---|---|
| A baseline | published rules (validation cell — must match backtest.js) | 161 | 46.6% | 0.82 | -323 | -170 | -153 |
| B long only | momentum longs only | 102 | 42.2% | 0.7 | -367 | -252 | -115 |
| C short only | momentum shorts only | 59 | 54.2% | 1.08 | +44 | +82 | -38 |
| D fade both | MEAN-REVERSION: trade against every signal | 161 | 54% | 1.22 | +330 | +193 | +137 |
| E fade pops | short the +5% pops only | 102 | 58.8% | 1.41 | +362 | +280 | +82 |
| F fade dumps | buy the -5% dumps only | 59 | 45.8% | 0.95 | -31 | -86 | +55 |
| G pullback | limit at signal close, wait 2 sessions (trigger-zone style) | 143 | 42% | 0.62 | -738 | -524 | -214 |
| H pullback short | pullback entries, shorts only | 53 | 49.1% | 0.65 | -262 | -216 | -46 |
| I chg8 | bigger shock: |8%| signal | 103 | 45.6% | 0.82 | -197 | -111 | -86 |
| J chg10 | bigger shock: |10%| signal | 78 | 41% | 0.69 | -311 | -191 | -120 |
| K rvol3 | heavier volume: 3x | 56 | 35.7% | 0.77 | -159 | -326 | +167 |
| L rvol5 | heavier volume: 5x | 17 | 41.2% | 0.8 | -31 | -45 | +14 |
| M sess3 | shorter hold: 3-session time-stop | 161 | 46% | 0.83 | -268 | -370 | +102 |
| N sess10 | longer hold: 10-session time-stop | 161 | 50.3% | 0.8 | -485 | -302 | -183 |
| O tight exits | tight geometry: TP1 8 / TP2 20 / stop 10 | 161 | 47.2% | 0.85 | -231 | -262 | +31 |
| P asym exits | asymmetric: TP1 16 / TP2 40 / stop 10 | 161 | 43.5% | 0.78 | -386 | -321 | -65 |
| Q runner | runner: TP2 60, 10-session hold | 161 | 50.3% | 0.81 | -463 | -302 | -161 |
| R short chg8 | gen2: shorts only + |8%| shock | 33 | 51.5% | 0.82 | -71 | +80 | -151 |
| S short sess3 | gen2: shorts only + 3-session hold | 59 | 45.8% | 0.69 | -186 | -150 | -36 |
| T fadepop rvol3 | gen2: short the pops + 3x volume | 35 | 74.3% | 1.53 | +156 | +259 | -104 |
| U pullshort tight | gen2: pullback shorts + tight exits | 53 | 43.4% | 0.71 | -171 | -125 | -46 |
Method (one paragraph)
close-to-close >=|5%| on >=2x 30d avg volume -> next-open entry; TP1 +16% underlying (half), TP2 +40% (rest), stop -20%, time-stop 5 sessions; premium proxy 2.5x; stop checked before TP; stops fill at worse of open/level, TPs fill at the level never better. Universe: NVDA, TSLA, AMD, PLTR, SMCI, MU, META, ORCL, MARA, RIOT, COIN, HOOD, SOFI, RIVN, LCID, OPEN, OKLO, RKLB, ACHR, PLUG, AAL, DAL, UAL, BBIO, IONS, QGEN, LASR, AVAV, OUST, HIVE, BBAI, WEN, AMC, GME, IONQ, RGTI, JOBY, CELH, UPST, AFRM. Every ambiguity was resolved against the strategy. Known limitations (disclosed): the universe was chosen with hindsight (survivorship bias); no commissions, spreads, slippage, or implied-volatility effects are modeled; overlapping signals are equal-weighted; six months is a single market regime. Hypothetical performance results have inherent limitations, are prepared with hindsight, do not reflect actual trading, and no representation is made that any account will or is likely to achieve similar profits or losses.
Cite this dataset
Free to quote and link (CC BY 4.0). Suggested attribution:
Disclosures. All figures on this page are HYPOTHETICAL and SIMULATED; no real trades were placed. ClaudeQuantAlgo is a research and education community and is not a registered investment adviser or broker-dealer. Nothing here is financial advice or a recommendation to buy or sell any security or derivative. Past performance — real or simulated — does not indicate future results. Trading involves substantial risk of loss.